The Cost of Money Affects Everything
- Mar 12, 2021
- 7 min read
Updated: Mar 12, 2021
“No one goes there nowadays, it’s too crowded.” – Yoggi Berra

Few market participants, both amateurs and professionals alike truly understand the impact bond yields, loans and the cost of short term money have on the price of assets throughout our economy. Often times, investment managers and advisers build portfolios giving little regard to the direction of interest rates (both short and long term), and pick stocks using either fundamental valuation metrics, or make decisions based on the hottest names with the most compelling stories. This is a mistake, as the cost of money (credit) has a large effect on everything financial – especially stocks.
Scott Minerd is the chief investment officer of Guggenheim Investments, an asset management firm. His fixed income background is unmatched in a market swimming with young unseasoned analysts, traders and money managers. Although I do not always agree with his conclusions, Mr. Minerd’s analysis usually gets me thinking. This time around, I am on-board with his view that after the recent jump in yields, we are at the top end of the interest rate range. From here, the risk down the road will likely be yield curve compression and possibly negative rates.
The below outlook piece is geared more for the professional. With this in mind, I do believe interested readers who do not possess a background in finance or economics will still benefit from his analysis.
*****
A Drunk Man in the Snow
The Random Walk of Interest Rates
By Scott Minerd – Global Chief Investment Officer and Chairman of Investments
Guggenheim Investments
March 2, 2021
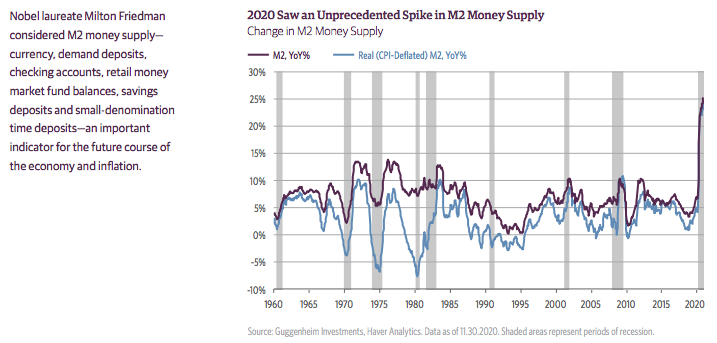
In the more obscure corner of the money market and banking statistics is the arcane data around bank reserves and money supply. One of the most important metrics in monetary theory is the money supply gauge referred to as M2. In its simplest definition, M2 represents the amount of money in currency, demand deposits, and checking accounts in the economy (the more narrow aggregate called M1) plus “near cash”—retail money market fund balances, savings deposits and small-denomination time deposits.
Now to the even more arcane world of the Federal Reserve’s (Fed) balance sheet, the liabilities of which include paper money, bank reserves and the U.S. Treasury’s general account.
As a hangover from the prior administration’s cash management, the Treasury currently holds about $1.6 trillion in its general account at the Fed, an amount far in excess of its pre-COVID cash balance target of roughly $400 billion. The Biden administration has decided to use more than $1 trillion of this excess cash to pay for stimulus rather than borrow new money. This is causing M2 money supply growth to soar at a rate of 25 percent over the past 12 months, more than five times the average annual growth rate going back to 1960.
The spike in M2 money supply can be explained by the massive fiscal stimulus deployed by the federal government, which was financed in large part by the creation of new money by the Federal Reserve. This stimulus has facilitated a surge in cash holdings throughout the economy from increased precautionary savings by households, businesses, and state and local governments.
As the stimulus checks go out, that cash moves into private sector checking accounts, causing M2 to balloon. Some of the money is spent, but most is saved. That unspent money eventually finds its way into securities markets either directly through investors or through banks choosing to invest deposit inflows in U.S. Treasury notes, Agency debentures and mortgage-backed securities, municipal securities, and asset-backed securities.
This flood of cash is driving short rates lower. Last week Libor set a record low of 18 basis points (bps) while Treasury bills now yield 3 bps and 2-year Treasury rates are at 16 bps.
As the money continues to flood into the private sector, we continue to see a rise in stock and bond prices. Over time, as stimulus payments and tax refunds are distributed and more money looks to be put to work, investors will extend maturities on their bond portfolios in a “reach for yield.”
Against this backdrop, 2-year Treasury note yields could go to 1 bp or lower and 5-year Treasury notes could easily reach 10 bps. These levels would put downward pressure on 10-year Treasury rates, likely rendering the current yield unsustainable.

In our model of 10-year Treasury yields, the sine regression of 10-year rates since the mid-1980s, actual yields have generally stayed within a two standard deviation range of the model estimates. Currently our model suggests that while yields may drift up from here, there is still more downside. The model estimate for a trough of -0.5 percent in early 2022 is bounded by a two-standard deviation range of a high of 1 percent and a low of -2.0 percent.

The good news is that fixed-income investors can properly position their portfolios by not being underweight duration. The bad news is that this would set the table for negative rates in the event of any unexpected bad news about the economy or financial system.
The foregone conclusion today is that long-term rates are on an uninterrupted trajectory higher. History tells us something different.
In the wake of the 1982 recession rates moved markedly higher in 1983. In that year gross domestic product (GDP) grew at 7.9 percent. Anticipating an inflation resurgence, long rates skyrocketed early that year, with 10-year rates rising from 10.1 percent to a peak of 12 percent. Despite the pronounced inflation anxiety, by 1986 10-year Treasury yields were probing lows around 7 percent, about 300 bps lower than before the selloff in 1983 got underway.

The same pattern occurred in the wake of the next two recessions. In 2008 the ten-year Treasury note touched a low of 2 percent. By 2010, as the economy began to rebound, bonds touched 4 percent only to subsequently fall to new lows of 1.4 percent in 2012.
Now, similar fears grip markets that reflationary pressures are paving the way to higher rates. No doubt, prices will rebound from post pandemic lows but given the surplus capacity throughout most of the economy and high levels of unemployment, any increase in the rate of inflation is likely transient.

Fed Chairman Jerome Powell has made it clear. Don’t look for restrictive policy from the Fed anytime soon. Prospects are for asset purchases to extend into next year with short-term rates to remain pegged at zero until at least 2024.
Against the backdrop of rather benign inflation and easy money, investors will be tempted to reach for yield. An upward sloping yield curve is one of the few avenues remaining that provides an opportunity for fixed income investors to boost current cash flow. At the end of the day, taking on duration risk to get any reasonable return on cash will prove a temptation too great to resist.
*****
The recent back-up in bond yields accelerated faster and has gone far higher than I envisioned. Unfortunately, this is not a complete surprise to me, as I have been doing this long enough to know that corrections/adjustments do not conform to my personal standards, but to the likely point of greatest pain.
For the time being, we are hearing about a future resurgence of inflation and higher growth from forecasters on the back of both monetary and fiscal stimulus, alongside a reopening of the global economy post COVID vaccinations.
I disagree on how things will play out – particularly with the inflation narrative and think much of the reopening is already priced in.
Over the past few decades inflation (as measured by global central banks) has trended lower in all the developed economies despite the ammunition policy makers have thrown at this perceived problem. Sure we get a quarter or so of an uptick in Personal Consumption Expenditures or the core reading of the Consumer Price Index, but ultimately the inflation numbers fizzle out and along with them so do bond yields. The main factors sustaining this broad trend are – globalization (cheap labor), demographic trends (developed world getting older), technological advancements (higher efficiencies and productivity), and finally greater debt loads to service, which likely pushes down future economic growth potential (think of a household financial statement where a larger share of earnings are required to pay off ballooning credit card debt leaving little savings left over for productive investment).
My belief that the winners will continue to take a larger share of the pie remains. Although there has been a recent rotation away from the technology sector, I fully expect continued outperformance as positioning adjustments are made from the weaker leveraged hands to the stronger long term players. As interest rates first stabilize and then resume their trend lower, technology and growth related industries will likely take back their leadership positions.

Sincerely,
Justin Kobe, CFA
Founder, Portfolio Manager & Adviser
Pacificus Capital Management

Advisory services through Cambridge Investment Research Advisors, Inc., a Registered Investment Adviser. Securities offered through Registered Representatives of Cambridge Investment Research, Inc., a broker-dealer, member FINRA/SIPC. Cambridge and Pacificus Capital Management are not affiliated. Material discussed is meant for general illustration and/or informational purposes only, and it is not to be construed as investment, tax, or legal advice. Although the information has been gathered from sources believed to be reliable, please note that individual situations can vary. Therefore, the information should be relied upon when coordinated with individual professional advice. These are the opinions of Justin Kobe and not necessarily those of Cambridge Investment Research, are for informational purposes only, and should not be construed or acted upon as individualized investment advice. Investing in the bond market is subject to risks, including market, interest rate, issuer credit, inflation risk, and liquidity risk. The value of most bonds and bond strategies is impacted by changes in interest rates. Bonds and bond strategies with longer durations tend to be more sensitive and volatile than those with shorter durations; bond prices generally fall as interest rates rise, and the current low interest rate environment increases this risk. Current reductions in bond counter-party capacity may contribute to decreased market liquidity and increased price volatility. Bond investments may be worth more or less than the original cost when redeemed. Diversification and asset allocation strategies do not assure profit or protect against loss.


Comments